Menu Our services in the selected location:
  • No services available for your region.
Select Location:
Remember my selection
Your browser is out of date.
GSAM Connect 
|
June 24, 2016

GSAM Connect | June 24, 2016

June 24, 2016 | GSAM Connect

After Brexit: Implications for Long-Term Investors

The sharp increase in market volatility following the United Kingdom’s surprise June 23 vote to exit the European Union (EU) raises a number of questions about investment strategy and implications. At Goldman Sachs Asset Management, we emphasize risk-aware portfolio construction in an effort to prepare investors for precisely these moments of surprise and market uncertainty. Although the U.K.’s EU exit likely entails challenges for investors in the near future, our long-term playbook of strategic, diversified, and risk-aware investing is unchanged.

We expect continued volatility as markets adjust to the economic, legal and political uncertainties of the U.K.’s exit process. It is plausible that U.K. and European economic growth could face headwinds as a result of the uncertainty and as capital flows reflect the investor reaction. We expect that a prolonged exit and negotiation process will create a significant drag on UK exports and overall economic growth, and a smaller but material drag on EU growth. As European financials, insurance, U.K. economically sensitive equities and Sterling are the most direct way for markets to express their views, we expect acute volatility in these areas in particular.

Key US impacts are likely to include a more dovish Federal Reserve (Fed). From a policy perspective, the most predictable implication is that the Fed is likely to be on hold for the foreseeable future. Ahead of the U.K. vote, the Fed had already signaled a great deal of caution in its policy normalization plans, which the Brexit-related shock amplifies. The Bank of England, ECB and Bank of Japan could all contemplate moves, but we expect this to be highly dependent on the market reaction over the next few days and months.

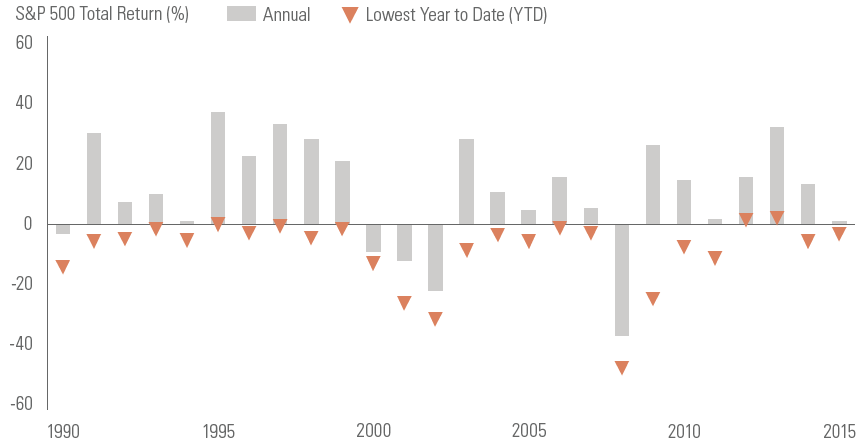
Selloffs are a normal investment experience. We would remind investors that shocks to the system are inevitable, and equity selloffs are historically frequent. In19 of 21 positive calendar-year returns since 1990, the S&P 500 spent some portion of the year in negative territory. For this reason, we see investors’ task as building in realistic assumptions for market turbulence. After an extended period of low volatility, markets may have entered a new phrase of more historically normal (higher) volatility.

Exhibit 1: S&P 500 Performance and Annual Lows Since 1990

Source: Bloomberg and GSAM.


Well-constructed portfolios can help investors stick to the plan. In our view, careful portfolio construction matters in all market environments, and especially during volatile periods like the present. We think the allocation decisions which drive well-built investment portfolios should be based on more than the recent past. As Exhibit 2 shows, an overreliance on any single asset class introduces the risk that investors may miss out on potentially attractive returns and/or increase the risk of market volatility. Taking a diversified approach potentially can help smooth the ups and downs of any particular investment.

Exhibit 2: Relative Asset Class Calendar-Year Performance

Source: Bloomberg, Morningstar, and GSAM as of 3/31/2016. All data represents total return. Past performance does not guarantee future results, which may vary. US Large Cap Equity is represented by the S&P 500 Index. Bank Loans are represented by the CS Leveraged Loan Index. Commodities are represented by the S&P GSCI Commodity Index. Emerging Market Debt is represented by the J.P. Morgan EMBI Global Index. Emerging Market Equity is represented by the MSCI Emerging Markets Index. Global High Yield Bonds are represented by the Barclays Global High Yield Index. Hedge Funds are represented by the HFRI Fund of Funds Index. International Equity is represented by the MSCI EAFE Index. International Real Estate is represented by the S&P Developed ex-US Property Index. International Small Cap Equity is represented by the S&P Developed ex US Small Cap Index. US Aggregate Bonds are represented by the Barclays US Aggregate Bond Index. US Real Estate is represented by the Dow Jones US Select Real Estate Securities Index. US Small Cap is represented by the Russell 2000.

Stay posted on the latest market developments and key themes for your portfolios and practices.
Get Connected

Related Posts

June 24, 2016 | GSAM Connect
Market Update: The European Union Referendum

GSAM portfolio managers react to the recent U.K. referendum on European Union membership.

June 06, 2016 | GSAM Connect
Interview: Shifting Gears for the Late Cycle

Credit cycles don’t die of old age. At seven years and counting, most recession indicators in the current cycle are quite benign and policy is very accommodative.

April 07, 2016 | GSAM Connect
Vexing Vix?

When it comes to market turbulence, what is normal? Watch Heather Miner, Global Head of GSAM's Strategic Advisory Solutions team, discuss ways investors can adapt to market swings and read the latest quarterly Market Know-How.