Menu
Our services in the selected country:
- No services available for your region.
In The Spotlight

Stay on top of the latest market developments, key themes, and investment ideas affecting your portfolio and practices.
globalnav.comp.homepage.mobile.contact.text
Talk to Us
Many investors rely on a limited number of assets as they build their portfolios. They tend to think that accessing a range of equity styles - "style box" investing - represents diversification. We believe that the style box approach does not go far enough. The historical returns of many equity style pairs have often been similar to one another.
To see historical results over time, select two styles and see the growth of $10,000.
There are many asset classes available to investors these days, but choosing the right ones for your portfolio can be difficult. Learn more about why portfolio construction matters below.
Many investors rely on a limited number of assets as they build their portfolios. They tend to think that accessing a range of equity styles - "style box" investing - represents diversification. We believe that the style box approach does not go far enough. The historical returns of many equity style pairs have often been similar to one another.
To see historical results over time, select two styles and see the growth of $10,000.
Source: Bloomberg and GSAM. As of September 30, 2018.
Past performance does not guarantee future results, which may vary. Volatility: As measured by standard deviation, a risk calculation of the dispersion of individual returns around the average return.
GROWTH OF $10,000: A graphical measurement of a portfolio's gross return that simulates the performance of an initial investment of $10,000 over the given time period. The example provided does not reflect the deduction of investment advisory fees and expenses which would reduce an investor's return. Please be advised that since this example is calculated gross of fees and expenses the compounding effect of an investment manager's fees are not taken into consideration and the deduction of such fees would have a significant impact on the returns the greater the time period and as such the value of the $10,000 if calculated on a net basis, would be significantly lower than shown in this example.
With tax reform enacted, budget caps raised and regulation rolled back, the US Administration has shifted its focus to trade policy, which has turned more hawkish in 2018.
Source: GSAM. As of September 30, 2018.
US Large Cap Equity is represented by the S&P 500. The S&P 500 Index is the Standard & Poor’s 500 Composite Index of 500 stocks, an unmanaged index of common stock prices.
US Aggregate Bonds are represented by the Barclays Aggregate Bond. The Barclays Aggregate Bond Index represents an unmanaged diversified portfolio of fixed income securities, including US Treasuries, investment-grade corporate bonds, and mortgage backed and asset-backed securities.
US Small Cap Equity is represented by the Russell 2000. The Russell 2000 Index is an unmanaged index of common stock prices that measures the performance of the 2000 smallest companies in the Russell 3000 Index
Bank Loans are represented by the Credit Suisse Leveraged Loan Index. The Credit Suisse Leveraged Loan Index tracks the investable leveraged loan market by representing tradable, senior-secured, US-dollar denominated, noninvestment-grade loans.
Emerging Market Equity is represented by the MSCI Emerging Markets Index. The MSCI Emerging Markets Index is a free float-adjusted market capitalization index that is designed to measure equity market performance of emerging markets.
International Equity are represented by the MSCI EAFE. The unmanaged MSCI EAFE Index (unhedged) is a market capitalization weighted composite of securities in 21 developed markets.
US Real Estate is represented by the Dow Jones US Select Real Estate Securities Index. The Dow Jones US Select RESI is a float-weighted index that measures US publicly traded real estate securities.
Emerging Market Debt is represented by the JPM EMBI Global Composite. The JPM EMBI is an unmanaged index tracking foreign currency denominated debt instruments of 31 emerging markets.
International Real Estate is represented by the S&P Developed ex-US Property Index. The S&P Developed ex-US Property Index measures the performance of real estate companies domiciled in countries outside the United States.
International Small Cap Equity is represented by the S&P Developed ex US Small Cap Index. The S&P Developed ex US Small Cap Index covers the smallest 20% of companies from developed countries (excluding the US) ranked by total market capitalization.
Commodities are represented by the the S&P GSCI Commodity Index. The S&P GSCI Commodity Index is a composite index of commodity sector returns, representing an unleveraged, long-only investment in commodity futures that is broadly diversified across the spectrum of commodities.
High Yield Bonds is represented by the Barclays Global High Yield Index. The Barclays Global High Yield Index provides a broad-based measure of the global high-yield fixed income market.
Hedge Funds are represented by the HFRI Fund of Funds Index. The HFRI Fund of Funds Index is an equal weighted, net of fee, index composed of approximately 800 fund-of-funds which report to HFR.
Past performance does not guarantee future results, which may vary.
Forecasting where and when opportunities may arise can be difficult. As illustrated in the chart below, fund flows suggest that retail investors have missed out on potential returns as a result of their timing decisions.
Past performance does not guarantee future results, which may vary. Shortfall, in this context, is defined as the difference in performance between the Morningstar category return and the asset-weighted investor return.
As the chart shows, some commonly owned investments have accounted for outsized proportions of portfolio risk. For instance, core equities historically have accounted for as much as 99% of overall portfolio risk.
Past performance does not guarantee future results, which may vary. This is for illustrative purposes only. The hypothetical historical returns were created with the benefit of hindsight using the percentage allocations indicated above. Any changes will have an impact on the hypothetical historical performance results, which could be material. Hypothetical performance results have many inherent limitations and no representation is being made that any investor will, or is likely to achieve, performance similar to that shown. In fact, there are frequently sharp differences between hypothetical performance results and the actual results subsequently achieved.
While investors must make choices about their individual risk tolerance, we believe a disciplined approach to portfolio construction creates the potential for improved returns and reduced risk.
Past performance does not guarantee future results, which may vary. The hypothetical historical returns were created with the benefit of hindsight using the percentage allocations indicated above. Any changes will have an impact on the hypothetical historical performance results, which could be material. Hypothetical performance results have many inherent limitations and no representation is being made that any investor will, or is likely to achieve, performance similar to that shown. In fact, there are frequently sharp differences between hypothetical performance results and the actual results subsequently achieved. Volatility: As measured by standard deviation, a risk calculation of the dispersion of individual returns around the average return.
With US equities at or near all-time highs, and global interest rates at or near all-time lows, we believe now is a particularly important time to consider diversifying these portions of traditional portfolios. Although specific allocations may vary over time, we view diversification as a long-term effort. Today, for many investors, this may be easier to accomplish than ever. Investors can access a number of diversifying and alternative strategies in broadly available investment tools such as mutual funds and exchange-traded funds.
Many investors have a heavy home-country bias, meaning they tilt their allocations towards what's familiar. Such a bias can mean missing out on a world of potential opportunity.
There are many tools that can potentially be used to diversify a portfolio. A "diversifier" is defined as a complement to an investor's traditional, or core, portfolio. Their risks have tended to diverge from the risks of core equities. Incorporating diversifiers into a well-balanced portfolio potentially enables investors to access several different sources of risk and return.
Seek to potentially provide exposure to asset classes that are broadly representative of the market
Have the potential to deliver higher returns derived from skilled active management
More efficient portfolio construction with higher return potential and increased diversification
Diversifiers are asset classes with attractive return potential and historically lower correlations when compared to core investments such as investment grade fixed income and most equities of developed markets. We believe the diversifiers below can be deployed in search of improved returns or lowered risk, and may help build more balanced portfolios.
Diversification does not protect an investor from market risk and does not ensure a profit. The portfolio risk management process includes an effort to monitor and manage risk, but does not imply low risk.
Use this tool to explore the potential benefits of adding diversifiers to a hypothetical portfolio.

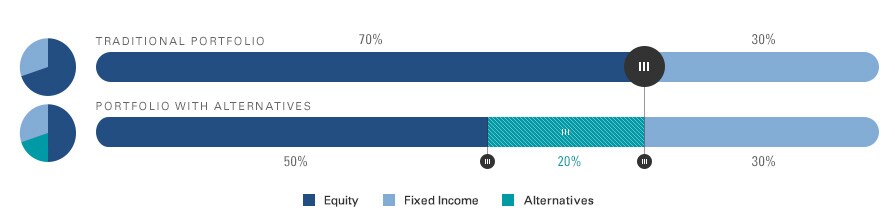
Alternatives are an additional tool that can potentially be used to diversify a portfolio. Alternative strategies may complement an investor’s traditional portfolio by employing tools such as shorting and/or leverage. Incorporating alternatives into a well-diversified portfolio potentially enables investors to access a differentiated source of return, lower the overall risk of their portfolios, and provide shallower drawdowns during market crises.
Past performance does not guarantee future results, which may vary. Drawdowns are declines in investment value. The use of alternative investment techniques such as shorting or leveraging creates an opportunity for increased returns but also creates the possibility for greater loss. Leverage increases a Fund’s sensitivity to market movements. Funds that use leverage can be expected to be more “volatile” than other funds that do not use leverage. This means if the instruments such a Fund buys decrease in market value, the value of the Fund’s shares will decrease by even more. Losses on short positions are potentially unlimited, since the positions lose value as the asset that was sold short increases in value. Taking short positions leverages a Fund’s assets, because the Fund is exposed to market movements beyond the amount of its actual investments.
Single Stocks have greater exposure to both outsized gains and outside losses. Sometimes they win big, but historically investors have faced losses in single stocks one-third of the time. We believe the diversification through an index can help investors reduce exposure to potentially punitive company specific risk while still participating in the matter.
Alternatives potentially offer attractive returns in challenging equity environments.
Alternatives can employ tools that can help mitigate interest rate risks and have historically performed well in rising risk environments.
Past performance does not guarantee future results, which may vary. GROWTH OF $100: A graphical measurement of a portfolio's gross return that simulates the performance of an initial investment of $100 over the given time period. The example provided does not reflect the deduction of investment advisory fees and expenses which would reduce an investor's return. Please be advised that since this example is calculated gross of fees and expenses the compounding effect of an investment manager's fees are not taken into consideration and the deduction of such fees would have a significant impact on the returns the greater the time period and as such the value of the $100 if calculated on a net basis, would be significantly lower than shown in this example.
HFRI FoF = HFRI Fund of Funds Composite Index; HFRI and related indices are trademarks and service marks of Hedge Fund Research, Inc. ("HFR") which has no affiliation with GSAM. Information regarding HFR indices was obtained from HFR’s website and other public sources and is provided for comparison purposes only. HFR does not endorse or approve any of the statements made herein.
The Hedge Fund Research, Inc. ("HFR") Fund of Funds Composite Index is an equal-weighted index of over 500 domestic and offshore fund of funds. All funds report in USD and report Net of All Fees returns on a monthly basis. All funds included in the index must have at least $50 million in assets under management or have been actively trading for at least 12 months. Source: Hedgefundresearch.com.
Alternative strategies often engage in leverage and other investment practices that are speculative and involve a high degree of risk. Such practices may increase the volatility of performance and the risk of investment loss, including the entire amount that is invested. Manager risk includes those that exist within a manager's organization, investment process or supporting systems and infrastructure. There is also a potential for fund-level risks that arise from the way in which a manager constructs and manages the fund. Bonds and Fixed income investing involves interest rate risk. When interest rates rise, bond prices generally fall. Leverage increases a fund's sensitivity to market movements. Funds that use leverage can be expected to be more "volatile" than other funds that do not use leverage. This means if the investments a fund buys decrease in market value, the value of the fund's shares will decrease by even more. Alternative strategies often make significant use of over-the-counter (OTC) derivatives and therefore are subject to the risk that counterparties will not perform their obligations under such contracts. Alternatives strategies may make investments that are illiquid or that may become less liquid in response to market developments. At times, a fund may be unable to sell certain of its illiquid investments without a substantial drop in price, if at all. There is risk that the values used by alternative strategies to price investments may be different from those used by other investors to price the same investments. The above are not an exhaustive list of potential risks. There may be additional risks that should be considered before investment decision.
Equity bear markets are defined as periods in which stocks realized at least a 15% drawdown. Fixed income bear markets are the five longest rising rate periods since 1990.
Use this tool to explore the potential benefits of adding alternatives to a hypothetical portfolio.
Learn about how to use the investment tools available to meet your investment goals.
Source: Bloomberg and GSAM. Analysis is based on chart data from January 1990, earliest common inception, to May 2015. Alternative strategies refers to the HFRI Fund of Funds Composite Index (HFRI FoF). Upside/Downside Capture ratio measures how much a given security has outperformed the broad market benchmark during periods of market strength and weakness. In the chart, Upside Capture is the performance of HFRI FoF relative to the S&P 500 during periods of positive S&P 500 returns. Downside Capture is the performance of HFRI FoF relative to the S&P 500 during periods of negative S&P 500 returns. The Upside Capture and Downside Capture ratio is the ratio of Upside Capture relative to Downside Capture. HFRI and related indices are trademarks and service marks of Hedge Fund Research, Inc. (“HFR”) which has no affiliation with GSAM. Information regarding HFR indices was obtained from HFR’s website and other public sources and is provided for comparison purposes only.
Perspectives on the latest market developments and trends
Tailored business strategies designed to strengthen key aspects of your practice
This is the text component