Please choose a role
Select your country:
Internal View
Log in
Menu Our services in the selected location:
  • No services available for your region.
Select Location:
Select Location
    Remember my selection
    View Global Site
    Your browser is out of date.
    bg-logo
        • Products
        • Mutual Funds
          • Featured
          • GS Core Fixed Income Fund
          • GS GQG Partners International Opportunities Fund
          • See All Mutual Funds
        • Exchange-Traded Funds
          • Featured
          • GS Future Tech Leaders Equity ETF (GTEK)
          • GS Future Planet Equity ETF (GSFP)
          • GS ActiveBeta International Equity ETF (GSIE)
          • See All ETFs
        • Liquidity Solutions
        • Separately Managed Accounts
        • Variable Insurance Trust
        • Target Date Portfolios
        • Close-Ended Funds
        • Interval Fund
        • All Funds
        • Premium Pgae
        • Test_11 value
        • test_12_value
        • homepage1
        • homepage2
        • Investment Centers
        • Municipal Bonds
        • Exchange-Traded Funds
        • Model Portfolios
        • Emerging Markets
        • Fixed Income
        • Big Data
        • Retirement (DCIO)
        • Buy-Write Strategy
        • Alternatives
        • 529 Plan
        • NNIP URL
        • NNIP URL 2
        • test url 12
        • test url 13
        • sma
        • separately managed account

      spotlight

      nnip title

      nnip desc
      Read More Access Full Article Suscribe
        • By Theme
        • Macro & Market Views
        • Investment Strategy
        • ESG/Sustainable Investing
        • ETF Investing
        • Quantitative Investing
        • Emerging Markets
        • By Asset Class
        • Fixed Income
        • Equities
        • Alternatives
        • More
        • GSAM Connect
        • All Insights
        • Goldman Sachs Global Investment Research
        • test PDF

      In The Spotlight

      test title

      test desc
      Read More Access Full Article Suscribe
        • Product Collateral
        • Product Brochures
        • Investment Solutions
        • Fact Cards
        • Fund Commentaries
        • Test Open in new Tab
        • Advisor Resources
        • Strategic Advisory Solutions
        • Asset Allocation PRISM
        • Practice Management
        • Client Service Account Access
        • Documents and Forms
        • Forms & Applications
        • Regulatory Documents
        • All Documents
        • Tools
        • Municipal Solutions Tool
        • Diversified Investment Allocation Tool
        • Floating Nav Vs. Stable Nav
        • Test Open in new Tab

      In The Spotlight

      Our In-Depth Commentary Could Help You Gain a Competitive Edge

      Stay on top of the latest market developments, key themes, and investment ideas affecting your portfolio and practices.

      Read More Access Full Article Suscribe
        • About Us
        • Overview
        • News and Media
        • Contact Us
        • Company Sites
        • Goldman Sachs
        • Private Wealth Management
        • Ayco Financial Management
        • Personal Financial Management
        • test globalnav
        • Login
        • Please choose a role
        • Internal View

    Explore how we can help you

    Talk to Us
    QUICK LINKS
    GSAM Connect
    Macro Insights
    GSAM Investment Outlook

    Quantinomics™

    Credit Card Data

    Credit Card Data may forecast earnings growth in the US more quickly than traditional methods.

    Economic Rationale


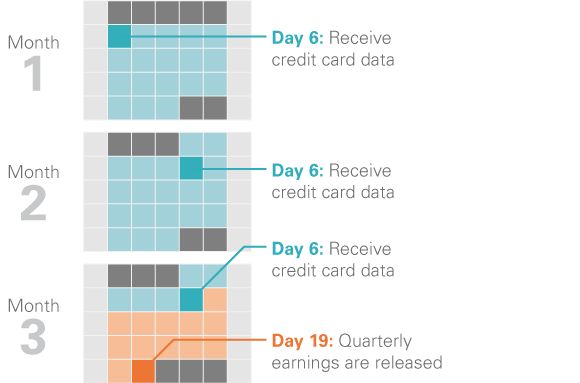
    Credit card transaction data may help provide an informational advantage.

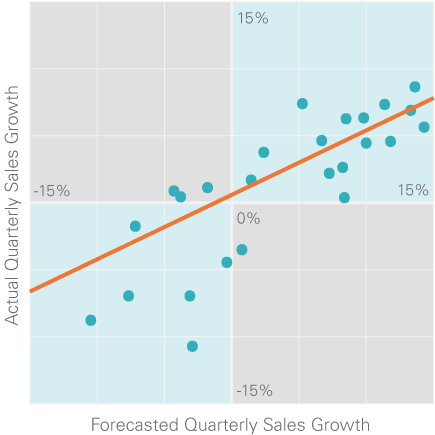
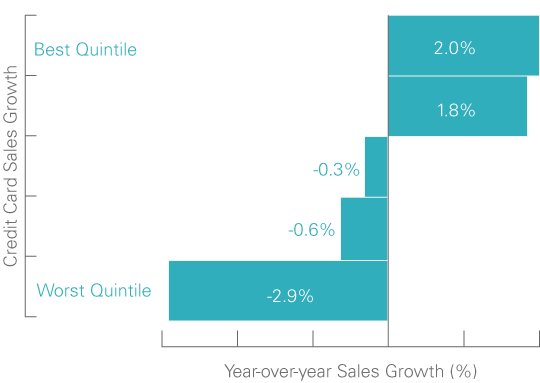
    Positioning portfolios towards companies that will surprise the market may help generate outperformance. Credit card transaction data can be an effective tool in forecasting performance for certain companies before the market has fully realized and reacted.


    Since you've landed on this page,

    0

    credit card transactions have occurred in the United States.

    Data Source


    We receive US credit card sales data that covers multiple dimensions of consumer spending.

    Potential Informational Advantage: credit card data is provided monthly with a six day lag, while corporate earnings announcements occur quarterly with a two and a half week lag.


    Investment Insights


    The growth of the average transaction size may foreshadow improvements in profitability.

    By observing changes in the average transaction size, it is possible to glean whether sales growth is driven by an increase in volume or a widening of margins. Furthermore, the data may help predict sales growth for up to a year in the future due to persistence in the growth of ticket size.


    Case Study


    Hardware Stores

    The credit card data signal may be effective when applied to consumer sectors and industries where credit card networks are used more often. Home improvement stores, for example, cater to consumers and small businesses—two groups that often pay with credit cards.

    Correlation to Actual Growth

    Credit card data arrives monthly, providing insights into profitability between quarterly earnings reports. Because the forecasted quarterly sales growth is positively correlated with actual quarterly sales growth, we believe we can gain an informational edge and potentially better price securities more quickly than the broader market.

    Credit card forecasts are positively related to actual revenue growth

    Source: GSAM. As of 1/31/2017. For illustrative purposes only. Represents Quarterly Year over year sales results and forecasts of the Home Improvement Retailer sub-industry from 1.31.08–1.31.17. The upward sloping line represents the positive correlation between forecasted quarterly sales growth and actual quarterly sales growth. Past correlations are not indicative of future correlations, which may vary. 


    Informational advantage

    Source: GSAM. For illustrative purposes only. The graphic illustrates potential informational advantage of receiving monthly credit card data with a six day lag, while corporate earnings are typically released quarterly with a two and a half week lag.

    Companies with greater credit card sales growth tend to have stronger YoY sales growth in the following year

    Source: GSAM. For illustrative purposes only. The chart shows the year-over-year (YoY) sales growth for each quintile of the YoY growth in average credit card ticket size. YoY Sales Growth is calculated as the yearly sales growth above or below average yearly sales growth from March 31, 2008 to December 30, 2017. There were 113 companies in the universe as of December 30, 2017.

    SUBSCRIBE

    Get updates delivered to your inbox as soon as they publish

    SUBSCRIBE

    DOWNLOAD

    Download a PDF of article

    RETURN TO:
    Quantinomics™

    Previous article
    Equity Factor Investing 101
    Next article

    Products & Investment Centers

    • Products
      • Mutual Funds
      • Exchange-Traded Funds
      • Liquidity Solutions
      • Separately Managed Accounts
      • Variable Insurance Trust
      • Target Date Portfolios
      • Close-Ended Funds
      • Interval Fund
      • All Funds
      • Premium Pgae
      • Test_11 value
      • test_12_value
      • homepage1
      • homepage2
    • Investment Centers
      • Municipal Bonds
      • Exchange-Traded Funds
      • Model Portfolios
      • Emerging Markets
      • Fixed Income
      • Big Data
      • Retirement (DCIO)
      • Buy-Write Strategy
      • Alternatives
      • 529 Plan
      • NNIP URL
      • NNIP URL 2
      • test url 12
      • test url 13
      • sma
      • separately managed account

    Market Insights

    • By Theme
      • Macro & Market Views
      • Investment Strategy
      • ESG/Sustainable Investing
      • ETF Investing
      • Quantitative Investing
      • Emerging Markets
    • By Asset Class
      • Fixed Income
      • Equities
      • Alternatives
    • More
      • GSAM Connect
      • All Insights
      • Goldman Sachs Global Investment Research
    • test PDF

    Tools & Resources

    • Product Collateral
      • Product Brochures
      • Investment Solutions
      • Fact Cards
      • Fund Commentaries
      • Test Open in new Tab
    • Advisor Resources
      • Strategic Advisory Solutions
      • Asset Allocation PRISM
      • Practice Management
      • Client Service Account Access
    • Documents and Forms
      • Forms & Applications
      • Regulatory Documents
      • All Documents
    • Tools
      • Municipal Solutions Tool
      • Diversified Investment Allocation Tool
      • Floating Nav Vs. Stable Nav
    • Test Open in new Tab

    About Us

    • About Us
      • Overview
      • News and Media
      • Contact Us
    • Company Sites
      • Goldman Sachs
      • Private Wealth Management
      • Ayco Financial Management
      • Personal Financial Management
    • test globalnav
    • Follow us on Linkedin
    VIEW LESS DISCLOSURE

    • Privacy Policy
    • Learn More About Security
    • Terms of Use
    • AdChoices
    • © 2025 Goldman Sachs. All rights reserved.