Menu Our services in the selected location:
  • No services available for your region.
Select Location:
Remember my selection
Your browser is out of date.
GSAM Connect 
|
January 08, 2016

GSAM Connect | January 08, 2016

The Case for Blending Income Sources

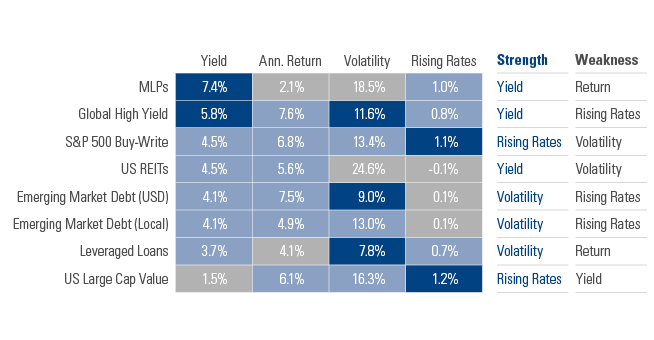
Income-generating asset classes rarely offer the full package of yield, total return, a smooth investment experience, and management of interest rate risks. Instead, as Exhibit 1 illustrates, these asset classes often require tradeoffs between competing goals. The effort to increase yield, for instance, has often come at the expense of higher volatility. Or management of interest rate risk in some cases has required the acceptance of lower yield.

How can investors pursue the income they seek while mitigating these unwanted tradeoffs?

EXHIBIT 1: SINGLE SOURCES OF INCOME ENTAIL TRADEOFFS

Source: Bloomberg, Morningstar, and GSAM. As of November 2015. Abbreviations in Exhibit 1 and the corresponding allocations of the asset classes comprising the Diversified Income Portfolio in Exhibit 2: MLPs refers to the Alerian MLP Index (13.2%). Global High Yield refers to the Barclays Global High Yield Index (17.4%). Emerging Market Debt (USD) refers to the J.P. Morgan EMBI Global Diversified Index (7.8%). Emerging Market Debt (Local) refers to the J.P. Morgan GBI-EM Global Diversified Index (6.8%). S&P 500 Buy-Write refers to the CBOE S&P 500 BuyWrite Index (30%). Leveraged Loans refers to the Credit Suisse Leveraged Loan Index (6.8%). Ex-US REITS refers to the FTSE EPRA/NAREIT ex US TR index (3.7%). US REITs refers to the FTSE NAREIT Composite TR Index (4.3%). US Large Cap Value refers to the Russell 1000 Value Index (10%). Yield assumptions are represented by the asset-weighted average 12-month yield of the Institutional and No-Load Shares, excluding those funds with 12-b(1) fees, in the Morningstar peer groups, respectively, through November 30, 2015. Diversification does not protect an investor from market risk and does not ensure a profit. Please see end disclosures for additional definitions. Past performance does not guarantee future results, which may vary.


In our view, blending income sources has the potential to help investors pursue a wider range of objectives, blunting some of these tradeoffs. To illustrate how, let’s walk through the historical returns of a diversified income portfolio – a portfolio which is comprised of a range of asset classes, such as those shown in Exhibit 1.

EXHIBIT 2: HISTORICAL RESULTS OF BLENDING INCOME SOURCES

Source: Bloomberg, Morningstar, and GSAM. These illustrative results do not reflect any GSAM product and are being shown for informational purposes only. No representation is made that an investor will achieve results similar to those shown. The S&P 500 refers to the S&P 500 Index and Barclays Agg refers to the Barclays US Aggregate Bond Index. Yield shown is the current dividend yield for the S&P 500 and yield to worst is for the Barclays US Aggregate Bond Index as of November 2015. Yield assumption for the Diversified Income Portfolio is the aggregate yield of the top chart asset class yields weighted at the respective weights from the top chart notes. Return and Volatility are annualized using monthly returns from June 2006 to November 2015. Rising Rate Performance represents the average monthly return when the 10-Year Treasury Yield rises.Diversification does not protect an investor from market risk and does not ensure a profit. Please see end disclosures for additional definitions. Past performance does not guarantee future results, which may vary.


Over the last decade or so, this more diversified approach – which includes equity and fixed income investments from both US and global markets – offered what we view as an attractive set of characteristics (Exhibit 2). These included:

  1. A higher yield (4.6%) than either US large-cap stocks, as represented by the S&P 500 Index (2.1%), or bonds, as represented by the Barclays Aggregate Bond Index (2.5%)
  2. Annual returns comparable to the S&P 500 (6.2% versus 7.7%)
  3. Annualized volatility (11.9%) which was lower than stocks (15.4%)
  4. Annualized performance during periods of rising interest rates (0.8%) ahead of bonds (-0.3%) and only modestly behind stocks (1.5%)

While this more diversified portfolio bore its own set of risks and tradeoffs – for instance, higher volatility than bonds – we view the overall set of characteristics as attractive for income-oriented investors.

Stay posted on the latest market developments and key themes for your portfolios and practices.
Get Connected

Related Posts

September 30, 2015 | GSAM Connect
Income Portfolios: In Search of Longevity

We believe investors should understand the link between lower volatility portfolios and the income potential they seek.

November 11, 2015 | GSAM Connect
Do You Know Where Your Risk is?

In our view, many investors fail to understand where a portfolio’s risks and returns come from -- we believe the answer can be surprising.